Strategy Compare — User Manual
Live P&L dashboard grouped by magic number · MetaTrader 4 & 5 · version 1.10
Strategy Compare answers one question: which of your Expert Advisors is actually making money? It reads the account history, splits it by magic number and puts every strategy on its own row of a live table drawn on the chart — profit by period, win rate, profit factor, drawdown, worst losing streak and an equity trend. Click a row and you get the full statistics of that single strategy.
1. Installation
You must allow DLL imports. This edition checks online whether a newer version is available, so it
needs Allow DLL imports. Without it the dashboard is not drawn at all — the indicator only
shows a small card explaining how to enable it.
Right-click the indicator on the chart → Properties → Common tab → tick Allow DLL imports, then remove the indicator and attach it again. You can also enable it once for the whole terminal in Tools → Options → Expert Advisors.
MetaTrader 5
- Open MT5 and go to File → Open Data Folder.
- Go to
MQL5\Indicatorsand copy the.ex5file there. - Restart MT5, or right-click → Refresh in the Navigator.
- In the Navigator, expand Indicators and drag Strategy Compare onto any chart.
- Tick Allow DLL imports in the Common tab and press OK.
MetaTrader 4
- Open MT4 and go to File → Open Data Folder.
- Go to
MQL4\Indicatorsand copy the.ex4file there. - Restart MT4, or right-click → Refresh in the Navigator.
- In the Navigator, expand Indicators and drag Strategy Compare onto any chart.
- Tick Allow DLL imports in the Common tab and press OK.
Use a chart you do not trade actively and leave Hide_Chart_Elements on: candles, grid and
scales disappear and only the dashboard stays on screen.
2. Reading the dashboard
The header shows the result of the whole account in large type, the same figure as a percentage of the balance, Today / Week / Month, and the portfolio equity curve with a D / W / M / ALL selector. Under it, one block per strategy, on two lines.
- First line — the money. Open P&L, Today, Week, Month, All Time, then Max DD, win rate, profit factor and the trend of that strategy over the last 90 days.
- Second line — the context. Magic number and time since the last trade, the percentage of balance for each period, pips, Max Loss, the number of trades and the average trade.
- Weight bar. The short bar under each strategy name shows how much that strategy weighs on the account: a long bar means it is carrying your results, for better or for worse.
- PORTFOLIO card. At the bottom, the same columns totalled, with the open positions and the best and worst strategy of the period.
- Title bar. The FULL/COMPACT button changes the view, the sun/moon button changes the theme and the "-" button collapses the panel to its title bar.
- Scrolling. When the panel is taller than the chart window, drag the scrollbar on the right or click the track. On MT5 the mouse wheel works too.
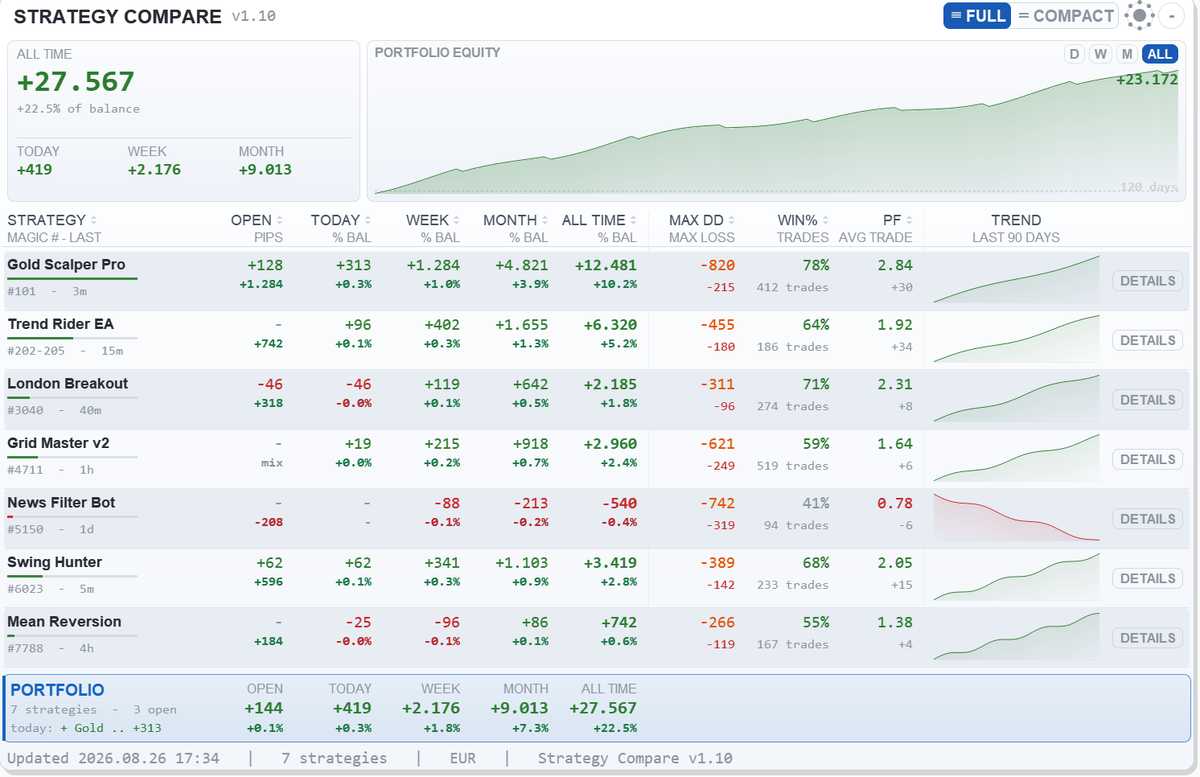
Max DD and Max Loss are two different things. Max DD is the worst floating drawdown that strategy reached while its trades were open, and it is saved to a file so it survives a restart. Max Loss is the worst run of consecutive losing trades once closed.
3. FULL and COMPACT
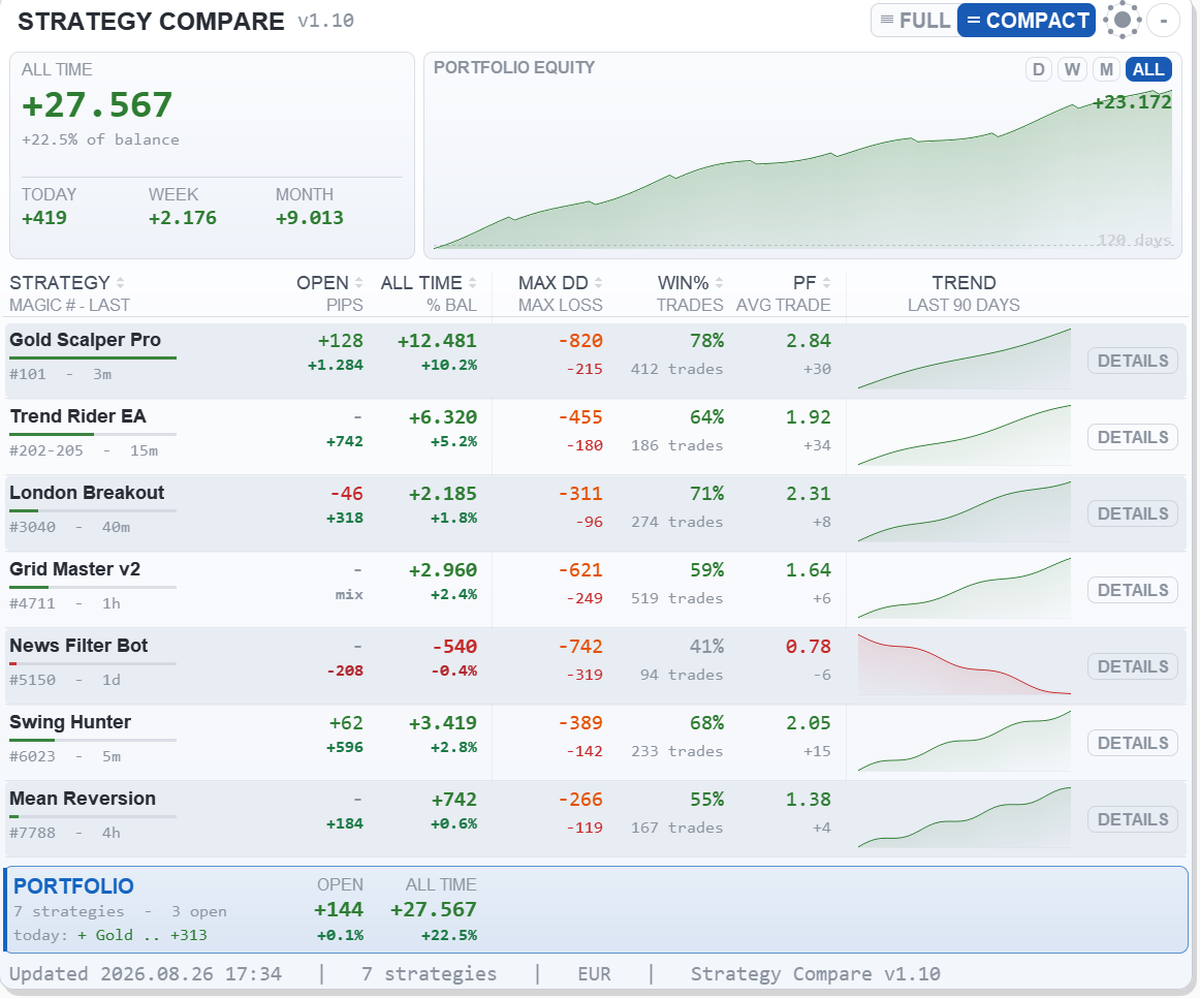
FULL shows Open, Today, Week, Month and All Time side by side. COMPACT shows one period at a time — you pick it with the DAY / WEEK / MONTH / ALL chips in the title bar — and gives back a large part of the width. The button in the title bar switches between the two and the choice is remembered for that chart. If the panel is still wider than the chart window it scales itself down automatically, so nothing is ever cut off.
4. Themes
The whole panel is drawn pixel by pixel, so it can follow the look of your chart instead of fighting it.
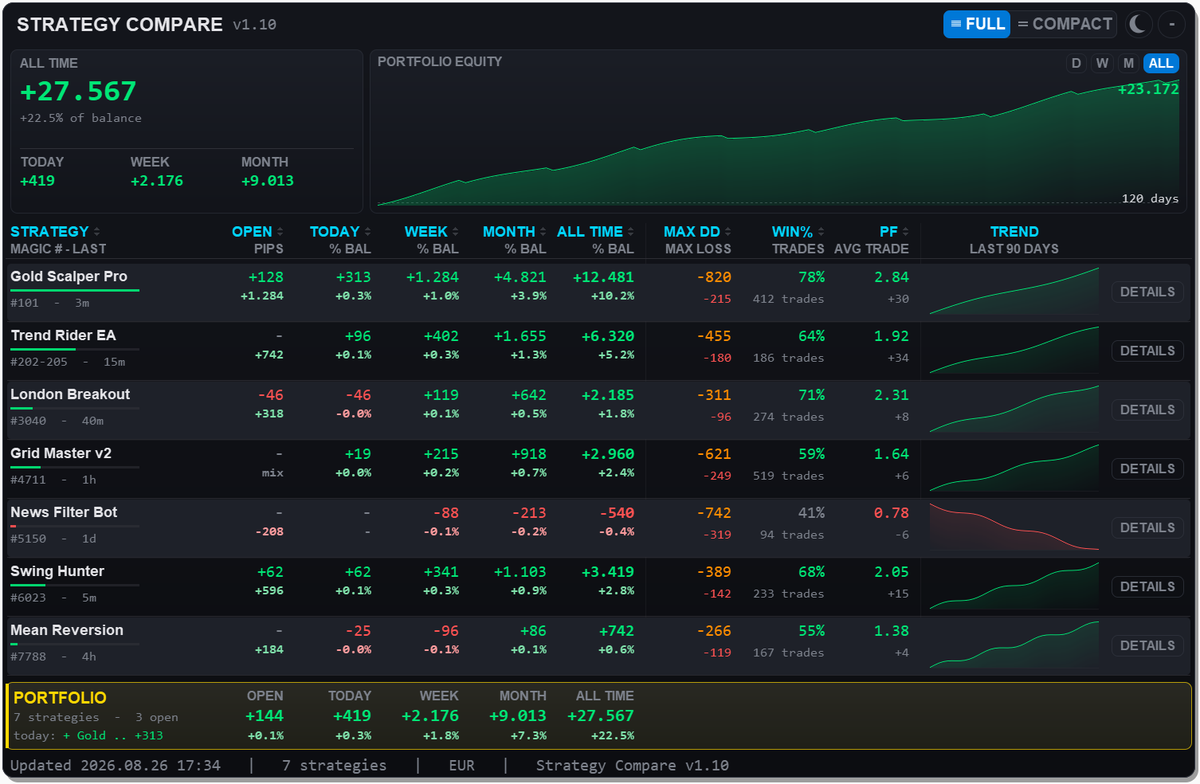
The sun/moon button switches between the light theme and your last dark theme, per chart. Five themes are
available from the Color_Theme setting: Minimal (light), Dark Pro, Ocean, Matrix and Sunset.
5. The strategy card
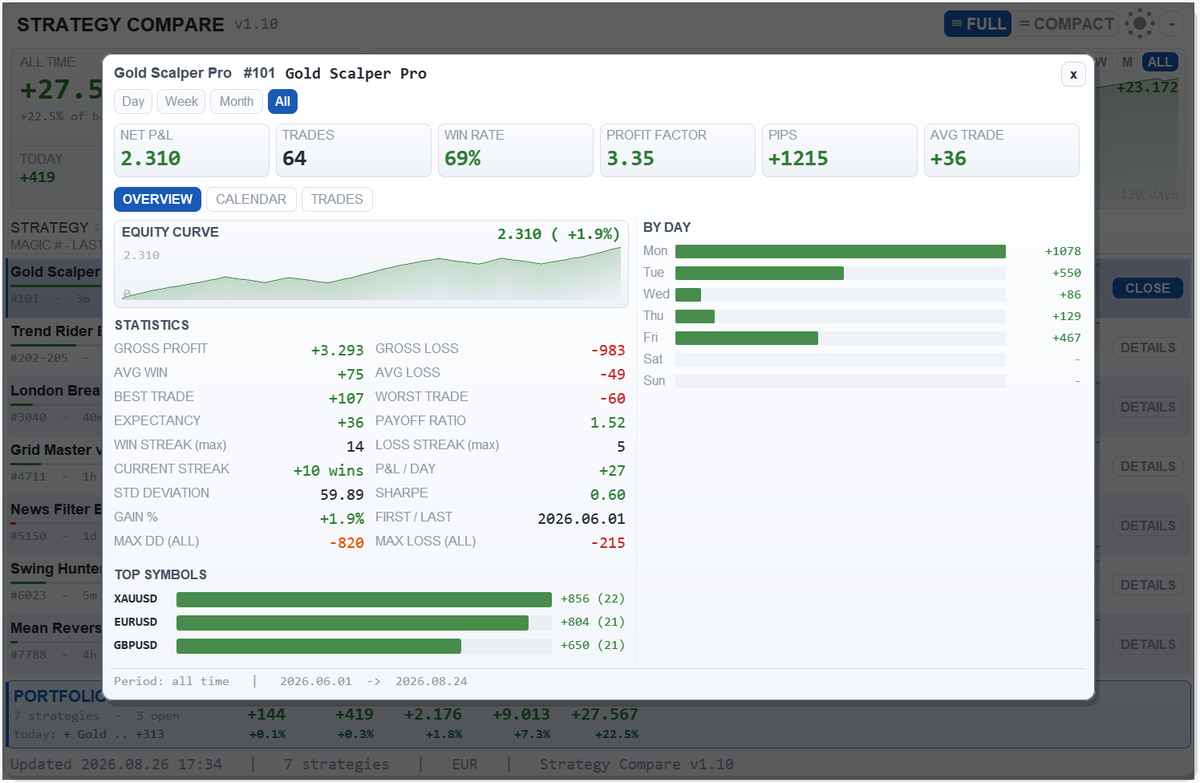
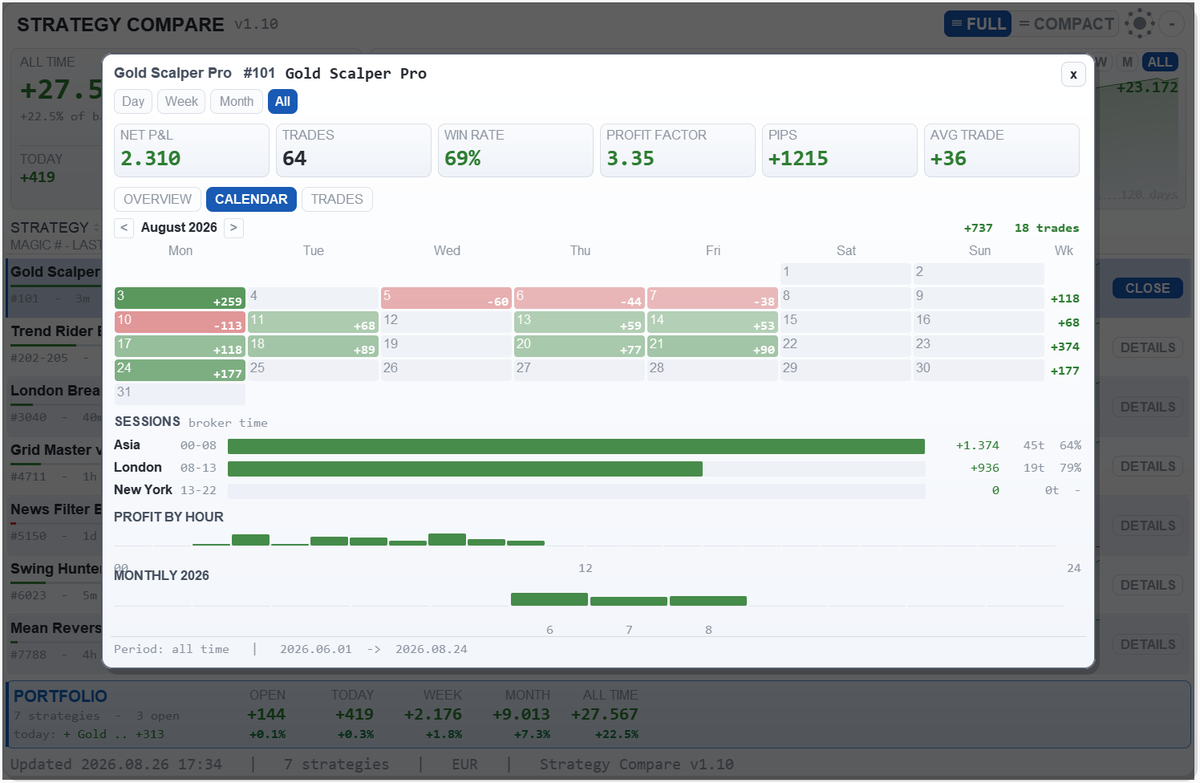
Click any row — or its DETAILS button — to open it. At the top, six figures for the selected period: net P&L, number of trades, win rate, profit factor, pips and average trade. The Day / Week / Month / All chips change all of them at once. Below, three tabs:
- Overview — the equity curve of that strategy, eighteen statistics (gross profit and loss, average win and loss, best and worst trade, expectancy, payoff ratio, longest winning and losing streaks, current streak, standard deviation, P&L per day, all-time Max DD and Max Loss), the profit by day of the week and the top symbols.
- Calendar — a month of daily results with weekly totals and month navigation, the split by trading session (Asia, London, New York), the profit by hour of the day and the monthly bars of the year.
- Trades — the latest closed trades with close date, symbol, lot size, pips, money and percentage.
6. Rename and group your magic numbers
A table of numbers is hard to read. The three Rename & group magics fields give your strategies their real names and merge grid or basket EAs that use a range of magics into a single row.
| What you want | What to write |
|---|---|
| Rename one magic | 123=Gold Scalper |
| Group a range | 8000-9000=Grid Master |
| Several rules together | 100=Scalper,8000-9000=Grid,555=News |
| Merge into one strategy | 100=Gold,200-300=Gold |
Two rules with the same name become a single row, even if the magics are far apart. Merged rows are marked with an asterisk and their Max DD is tracked from the moment you grouped them. Magic 0 — trades opened by hand — is shown as Manual Trades. There are three fields because a single MetaTrader input cannot hold more than 248 characters; they are simply joined together.
7. Input parameters
| Setting | What it does |
|---|---|
| Visualization | |
| Font_Size_MainTitle (default 12) | font size of the title bar. The panel never goes below 10. Example: 14 on a 4K monitor. |
| Font_Size_TableHeader (default 10) | font size of the column headers (minimum 8). Example: 11 to make the headers stand out. |
| Font_Size_Values (default 11) | font size of the rows, and the master size of the whole panel: row height, column widths, charts and buttons all scale with it (minimum 10). Example: 13 for a big, readable dashboard. |
| Magic_Number_Digits (default 12) | how many characters of the magic number (or range) are shown on the second line of each row. Example: with 6, magic 12345678 is shown as 123456. |
| Strategy_Name_Length (default 24) | how many characters of the strategy name are shown. Example: 12 for a narrower panel. |
| Show_WinRate (default true) | show the WIN% column, with the number of trades under it. Example: false if you only care about money. |
| Show_ProfitFactor (default true) | show the PF column, with the average trade under it. |
| Show_Account_Summary (default true) | show balance, equity, account number and deposits in the header. Example: false for a table-only panel. |
| Show_Charts (default true) | show the portfolio equity chart in the header and the trend chart in every row. Example: false for a much narrower panel. |
| Equity_Curve_Scale (default By period) | how the curves are sampled. By period automatically uses daily, weekly or monthly points depending on how long your history is, so averaged-down baskets do not show false dips; By trade plots one point per closed trade. Example: By trade to inspect a scalper in detail. |
| PnL_Display (default Money + % of balance) | what the second line under each amount shows. Money only removes the percentages from the whole table. |
| CustomPipsCalcForPairs (default XAUUSD=2,BTCUSD=-10) | override the pip size of specific symbols, comma separated. SYMBOL=n forces the pip to the n-th decimal digit; SYMBOL=-n means n price units = 1 pip. Examples: XAUUSD=2 makes 1 pip = 0.10 on gold, US30=-1 makes 1 pip = 1 index point. When a row groups trades of different symbols the PIPS cell shows mix. |
| Filters (display only - they never touch your trades) | |
| Only_Show_Magic_Used_in_the_Last_Days (default 365) | hide magics with no activity in the last X days. Example: 7 shows only what traded this week; 0 shows everything ever traded. The values of the visible strategies are always computed on the full history. |
| Restrict_to_Specific_Magic_Numbers (default empty) | show ONLY these magics; single numbers and ranges. Example: 123, 8000-9000. |
| Exclude_Specific_Magic_Numbers (default empty) | hide these magics, same syntax. Example: 0, 555 hides manual trades and magic 555. |
| Grouping and names | |
| Rename & group magics 1/3, 2/3, 3/3 (default empty) | rename magics and merge ranges into a single strategy. Three fields because one input cannot hold more than 248 characters; they are simply joined together. See the section above for the syntax. |
| Look and performance | |
| Default_View (default FULL) | the view used when the indicator starts. The FULL/COMPACT button on the panel overrides it and the choice is remembered for that chart. |
| Color_Theme (default Minimal) | starting theme: Minimal (light), Dark Pro, Ocean, Matrix, Sunset. The sun/moon button on the panel overrides it, per chart. |
| Hide_Chart_Elements (default true) | hide candles, grid, scales and any other object drawn on the chart, so only the dashboard is on screen. Example: false to keep your candles visible behind the panel. |
| Update_Frequency_Seconds (default 1) | refresh rate in seconds (minimum 1). Example: 5 on a slow VPS to save CPU. |
| Max_History_Orders (default 5000) | maximum number of historical trades processed. Example: 20000 on an account with years of history. |
8. Sorting the table
Every column header is clickable. The small arrows mean the column is sortable and the arrow on the active column shows the direction. STRATEGY sorts alphabetically on the first click; the money and statistics columns sort from the biggest first. Click the same header again to invert the order.
9. Questions we get often
All my trades are on one row. Your EAs are using the same magic number, or none at all. Set a different magic in each EA; trades opened by hand stay together on magic 0.
A strategy is missing. It has not traded within the days set in
Only_Show_Magic_Used_in_the_Last_Days, or it is excluded by the magic filters, or — on MT4
— the Account History tab is not showing All History. The table can only show what the terminal has
loaded.
The totals do not match my balance. The header shows deposits and trading result separately: balance = deposits + trading result + floating P&L. Commissions and swaps are always included.
Max DD looks too big. It is the worst floating drawdown ever reached by that strategy, kept in a file so it is not lost on restart. It is a memory of the worst moment, not the current situation.
Does it work in the Strategy Tester? Not in a meaningful way: there is no account history to read there.
Strategy Compare v1.10 — free for MetaTrader 4 and MetaTrader 5.