
 Indicator · MT4 & MT5 · formerly Report by Magic / P&L by Magic
Which strategy is actually paying?
Strategy Compare puts every EA running on the account on its own row, grouped by magic number, and keeps the score: profit for the open positions, today, this week, this month and since the first trade, plus pips, win rate, profit factor, max drawdown and the worst losing streak. It reads your history, it never sends an order.
The whole thing in twenty seconds: full and compact views, light and dark themes, and the statistics card that opens when you click a strategy.
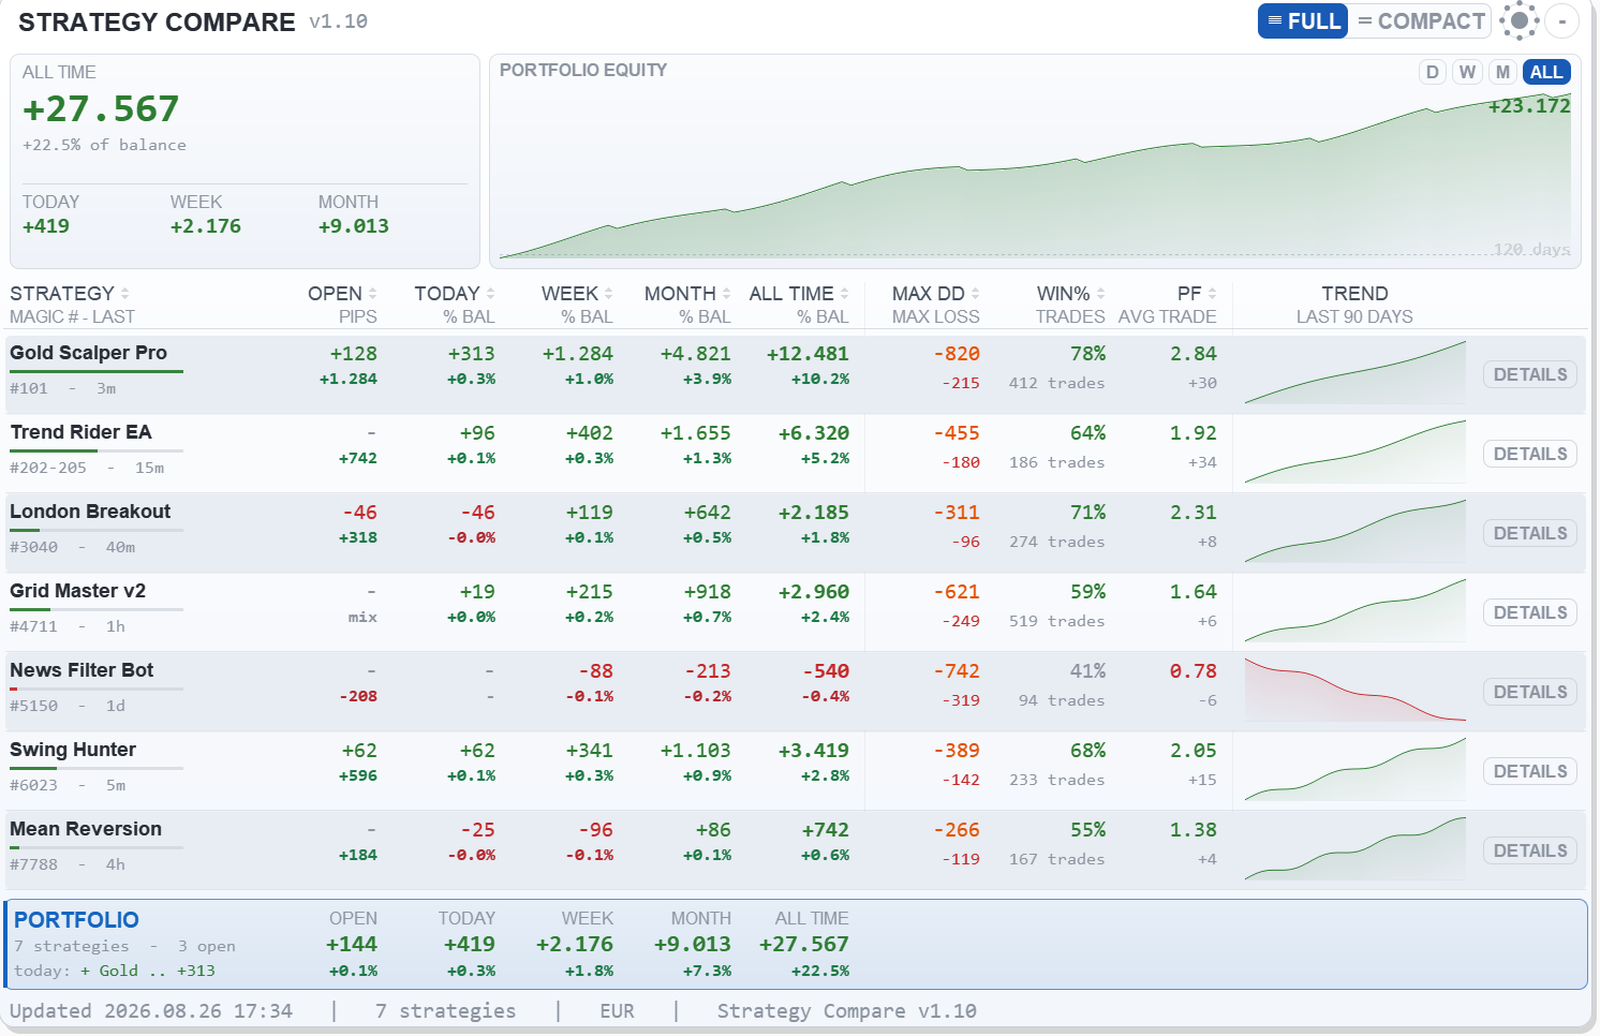
The account result on top with the portfolio equity curve, then two lines per strategy: the money on the first, percentages, pips and trade stats on the second. Click any header to sort.
The report MetaTrader never gives you.
The terminal shows you the account. Strategy Compare shows you the strategies inside it.
One row per strategy
Open, today, week, month and all-time profit, shown as money, percent or both. Totals for the whole account on the top line.
Magic numbers become names
Call 8001 “London breakout”. Give the same name to several magics, or to a whole range like 8000-8999, and they merge into a single aggregated row.
Beyond the profit column
Win rate, profit factor, pips, average trade, max drawdown tracked live on open positions and the worst losing streak on closed ones.
DETAILS opens the full file
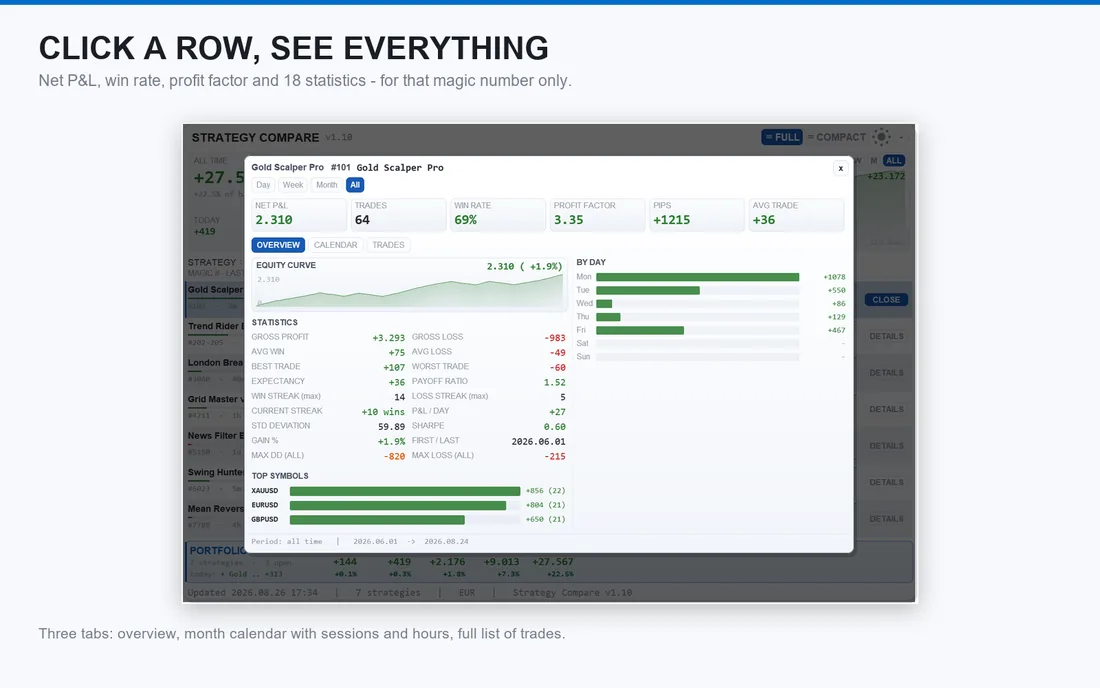
Per-strategy equity curve, monthly calendar, win and loss streaks, hour and weekday breakdown, Asia / London / New York sessions and the last trades in a list.
Only what you care about
Include or exclude magic numbers, hide strategies with no activity in the last N days, set custom pip sizes for metals, indices and crypto.
Themes and clean chart
Several colour themes, adjustable fonts, and a clean-chart mode that leaves the price alone while the panel does the talking.
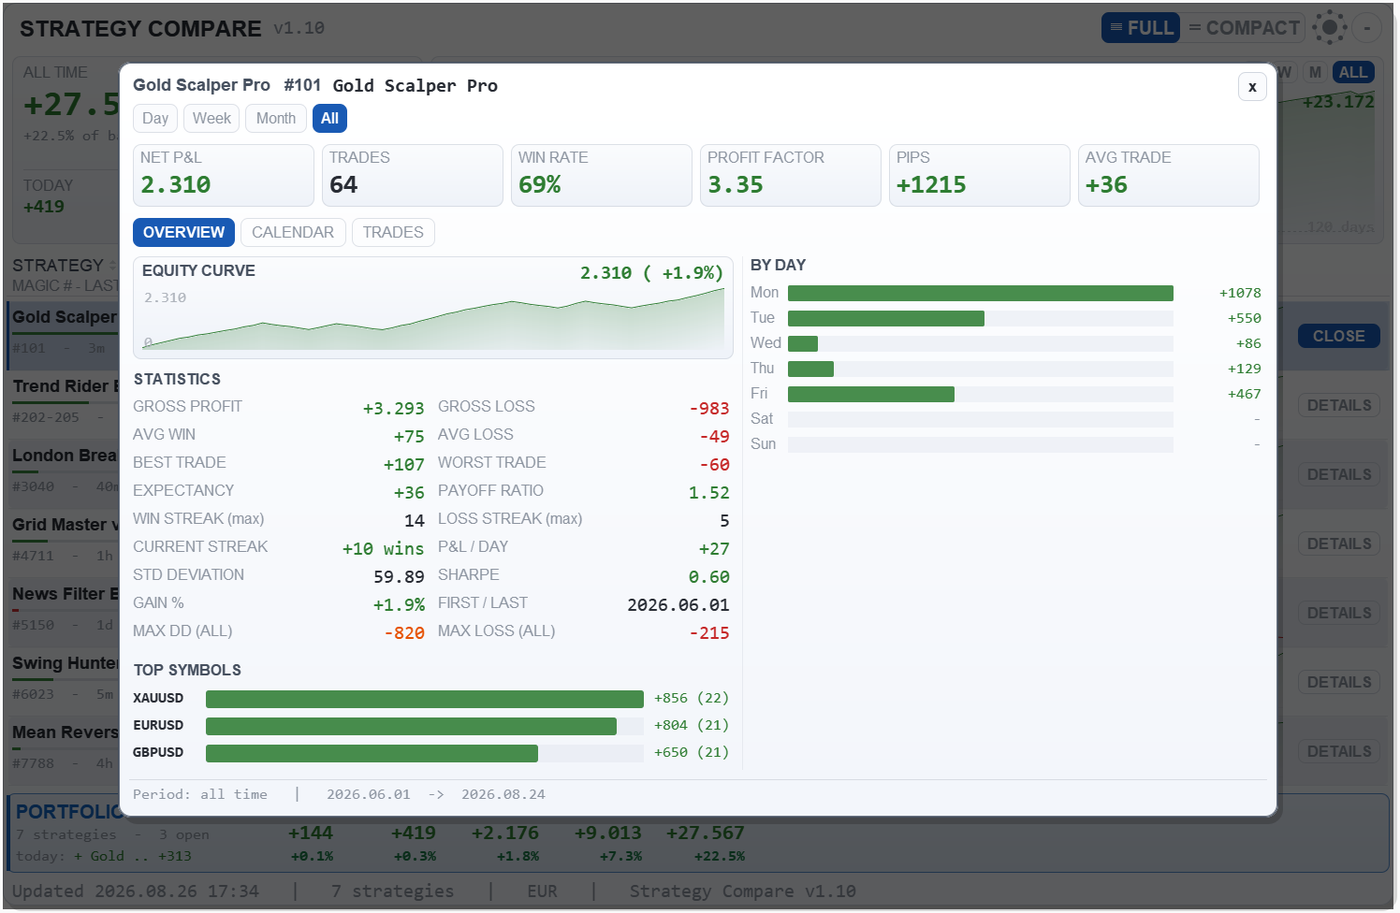
Every row has a DETAILS button. It opens the full history of that one strategy - statistics, calendar and trades - without touching the chart.
What each column means.
| Column | Reads | Notes |
|---|---|---|
| OPEN | Floating P&L of the positions still running | Broker credit and bonus are excluded |
| TODAY / WEEK / MONTH | Realized profit in the period | Money, percent of balance, or both |
| ALL TIME | Realized profit over the whole history | Always computed on the full history, even when the row is filtered |
| PIPS | Net pips of the strategy | Custom pip size for metals, indices, crypto |
| WIN % | Share of closed trades in profit | Per strategy, not per account |
| PF | Profit factor, gross win over gross loss | Above 1.00 means the strategy is net positive |
| MAX DD | Deepest drawdown reached | Tracked live on open trades and kept across restarts |
| MAX LOSS | Worst losing streak on closed trades | The number the equity curve never shows you |
Straight from the product page.
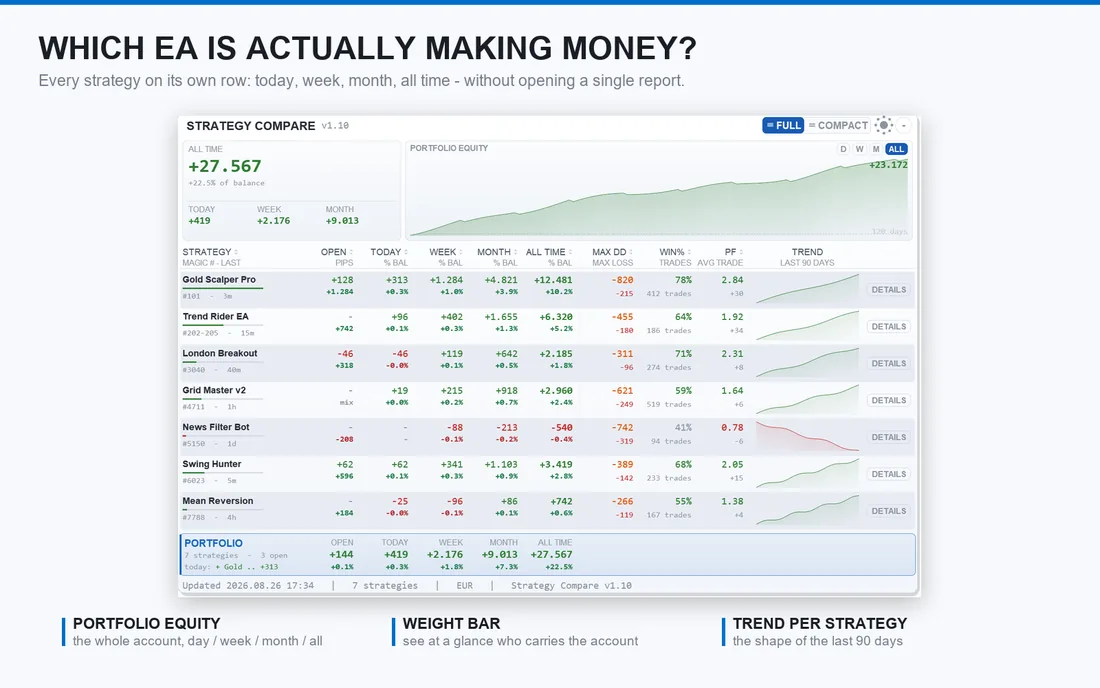
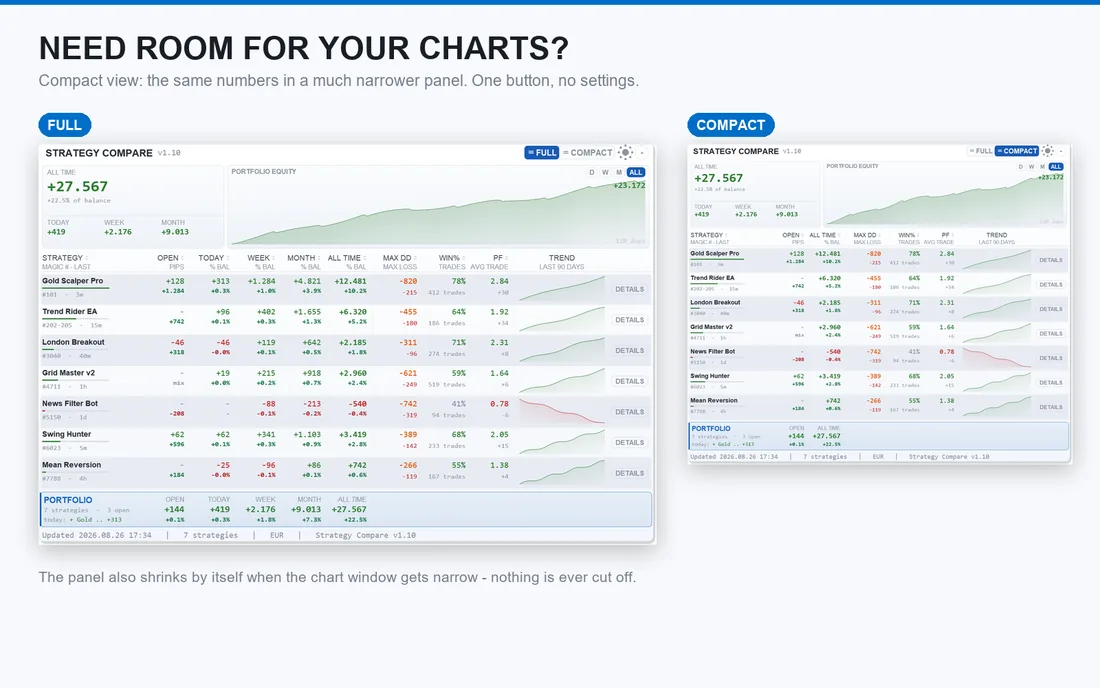
Click any image to open it full size.
Same dashboard. One of them carries an ad.
The free edition pays for itself with a small sponsor banner rotating inside the panel. PRO removes it and hands updates over to your MQL5 account.
- The full dashboard, every metric, every theme
- MT4 and MT5, both included
- A rotating sponsor banner inside the panel
- Updates announced on the Telegram channel, installed by hand
- No sponsor banner. The panel is yours
- Five activations, automatic updates from MetaTrader
- Free demo on the MQL5 Market before you pay
- MT4 and MT5 are two separate products
Two minutes.
- Download the ZIP for your platform from the buttons above and unpack it. Inside there is the indicator and the PDF guide - the same manual is readable online.
- In the terminal open
File → Open Data Folder, then drop the file intoMQL4/IndicatorsorMQL5/Indicators. - Restart the terminal, drag Strategy Compare onto any chart, tick Allow DLL imports in the Common tab, and let it read the history.
It is an indicator, not an EA: it never opens, closes or modifies a position, and it does not need automated trading enabled.
Closed history is cached and looked up by hash, so a few thousand trades cost close to nothing in CPU time.
Renamed from Report by Magic / P&L by Magic. Same tool, same author, clearer name.
Start free. Drop the ad when it earns its place.
Run the free edition on your live account tonight. If you end up keeping the panel open every day, the PRO edition removes the banner for good.